
Active Fund Managers vs. Indexes: Analyzing SPIVA Scorecards. By Murray Coleman.
A lack of consistency by active fund managers in beating their respective indexes has been a constant theme of S&P Global's SPIVA U.S. Scorecard. With roots tracing back to 2002, this benchmarking series — formally titled the "S&P Indices Versus Active" report — semiannually reviews data tracking performance of active fund managers against their respective indexes.
A wealth of academic evidence — from Nobel laureates such as Eugene Fama and Harry Markowitz to William Sharpe and Merton Miller — warns that trying to time markets as a reaction to stock price fluctuations is a foolhardy endeavor.
In their latest SPIVA report covering the past 20 years (through 2023), S&P researchers pointed out that a vast majority of active fund managers wound up as laggards when compared to their respective indexes. And such relatively poor results showed up regardless of short-term market conditions. In fact, they found "across all categories, underperformance rates typically rose as time horizons lengthened."
For example, the SPIVA1 report noted:
After one year, nearly 73% of active fund managers underperformed their indexes (across 22 equity categories).
At the five-year horizon, 95.5% of active stock fund managers lagged their indexes.
After 15 years, there were "no categories in which the majority of active managers outperformed" across domestic and international equities.
Similar shortcomings were uncovered in bond funds. In total, active fixed-income fund managers were compared against 39 different 'best-fit' benchmarks (S&P, Bloomberg and iBoxx) according to size, style and region (U.S., international developed and emerging).
As these SPIVA reports have consistently revealed, the facts just don't support claims that paying up for active management is worthwhile. The latest scorecard, for instance, found in the largest and most closely watched asset class — U.S. large-cap equity funds — active managers outperformed their respective indexes in just three of the past 23 years. Such losing fortunes included a 14-year streak that continued through 2023.
A similar picture of lagging returns appeared overseas. International developed stock fund managers were able to beat their respective indexes in four of the past 23 years, or 17.4% of the time. Meanwhile, emerging markets active fund managers fared even worse. They only managed to outperform in two years, or 8.7% of the time, during these 20-plus years.
The big picture takeaway of SPIVA's latest scorecard: In good times as well as bad, active management continues to produce underwhelming results. Indeed, stepping back and reviewing active fund management over longer periods provides an even clearer statistical view of the problem with trying to pick a winning stock or bond jockey.
Below are charts based on SPIVA's most recent data providing more specifics on the number of active funds that were unable to beat comparative indexes (by asset class) over extended periods.
Performance Comparisons
U.S. Equity
The pie charts below show the percentage of active U.S. equity funds that underperformed their respective benchmarks for the 20-year period ended Dec. 31, 2023.

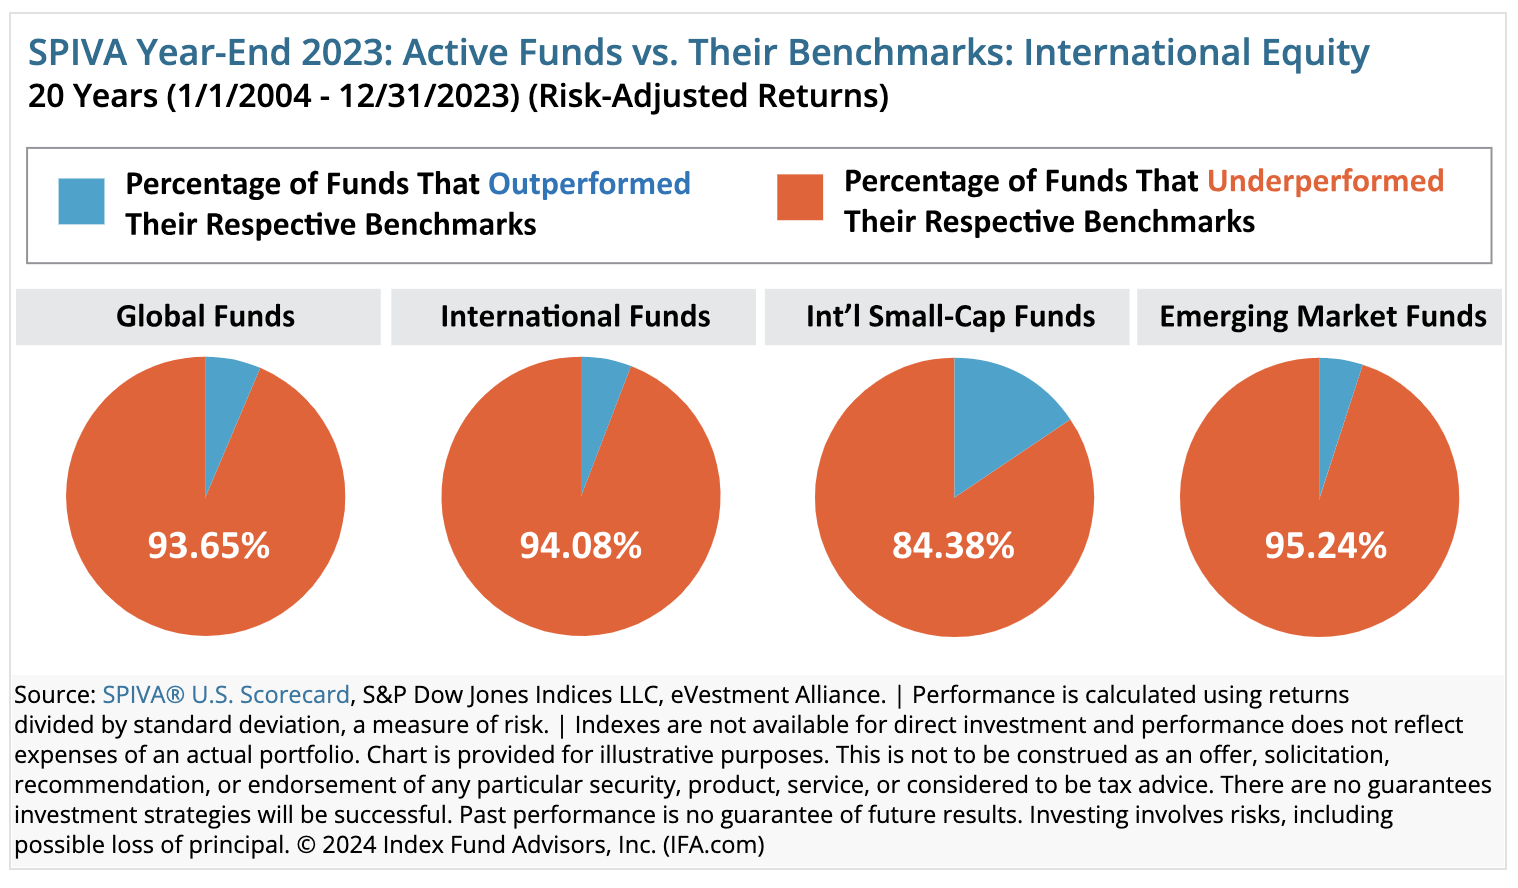
International Equity
The pie charts below show the percentage of active international equity funds that underperformed respective benchmarks for the 20-year period ended Dec. 31, 2023.
Fixed-Income
The pie charts below show the percentage of active bond funds that underperformed respective benchmarks for the 15-year period ended Dec. 31, 2023.

Lagging performance by active fund managers isn't a new story. As we've been chronicling for decades, leading market researchers know better than to listen to boasts about peer-beating results. Instead, managers are held to a higher standard — namely, how they've done against their respective benchmarks.
Besides comparing active managers against index results, the SPIVA research series also separates itself from the pack by taking into account survivorship bias and style consistency issues that can tilt performance numbers in active management's favor.
The SPIVA scorecard sorts through such 'noisy' data by scrubbing performance numbers in several different ways. Two of the most significant relate to:
Survivorship Bias. This is a common practice in which managers merge or close funds. In the past 20 years, according to SPIVA research, nearly 70% of domestic stock funds and more than two-thirds of international equity funds were shuttered or folded into other managers' coffers. Why is this so alarming? Poor results are essentially swept underneath the rug, either going away completely and/or replaced by another fund's performance record. Hence the "shell game" nomenclature.
Style Consistency. S&P researchers track how consistent managers are in following their style mandates. For example, if a large growth manager decides to buy a lot of value stocks at any given time, the SPIVA data will be adjusted to track those changes using a more appropriate benchmark and fund category. As a result, such a research methodology offers a more precise "apples-to-apples" comparison of relative performance over time.
At IFA, our investment committee encourages investors not to trust any research that doesn't scrub return numbers to take into account these types of actively managed "shell" games. As the latest data from S&P's SPIVA study indicates, (see charts below), the impact of survivorship bias and style consistency has proven to be significant over time.


In our own research, we've found a consistent pattern — active management doesn't live up to its own hype. The inclusion of the statistical significance of alpha is key to IFA's analysis when constructing a globally diversified portfolio of index funds. Taking such a scientific approach enables us to recognize if a manager's recent burst of outperformance is likely a result of luck — i.e., random chance — as opposed to actual skill.
The SPIVA research scorecard is just another piece of evidence that investors should not try to "beat the market" — and, are likely going to wind up failing, thereby jeopardizing a portfolio's long-term well-being. Along these lines, we remind investors that each IFA client is offered a complimentary holistic and unique financial plan. This planning tool is designed to serve as a comprehensive blueprint to help guide each person's wealth-building future.